
Apache Kafka® Unified Monitoring & Operations


A Unified Platform for Advanced Kafka DataOps
AxonOps Apache Kafka® Monitoring & Operations unified for Advanced DataOps
At AxonOps, our mission is to build the most advanced DataOps management platform — a unified solution that unifies monitoring and operations into a single intelligent control plane. With the release of the latest release of AxonOps, we’re excited to announce native support for Apache Kafka monitoring and operations.
Kafka, First-Class in AxonOps
Kafka plays a critical role in modern data infrastructure, yet its management often requires stitching together several disparate tools just to monitor Kafka brokers, manage Kafka consumers, and ensure end-to-end delivery guarantees. With the latest release of AxonOps, we’ve changed that.
You can now monitor and operate Kafka Brokers, Kraft Controllers, Zookeeper Nodes, and Kafka Connect — all from one portal.
No more juggling Prometheus, Grafana, Kibana, CLI tools, and homegrown scripts.
Unified Monitoring and Operations — Without the Latency
One of the biggest pain points in Kafka monitoring is the reliance on Prometheus exporter-based scraping Kafka metrics – especially in large clusters, where Kafka metrics collection often lags behind real-time needs.
AxonOps eliminates this bottleneck with a custom-built telemetry protocol designed for high efficiency and low latency when collecting and presenting Kafka metrics.
Built-In Best Practices (That You Can Customize)
AxonOps comes out-of-the box with pre-defined dashboards built on Kafka monitoring and operational best practices — covering everything from Kafka broker health and Kafka topic replication to consumer group lag. But because every organization operates differently, dashboards are fully customizable to fit your specific needs.
Correlate Faster
One particularly powerful feature is our log overlay capability: you can overlay logs directly onto your metrics dashboards within a specific time range. Spot an unusual Kafka metric? Just drag-select the time window and view the corresponding logs on the same screen — no more jumping between tools or copying timestamps into separate log viewers.
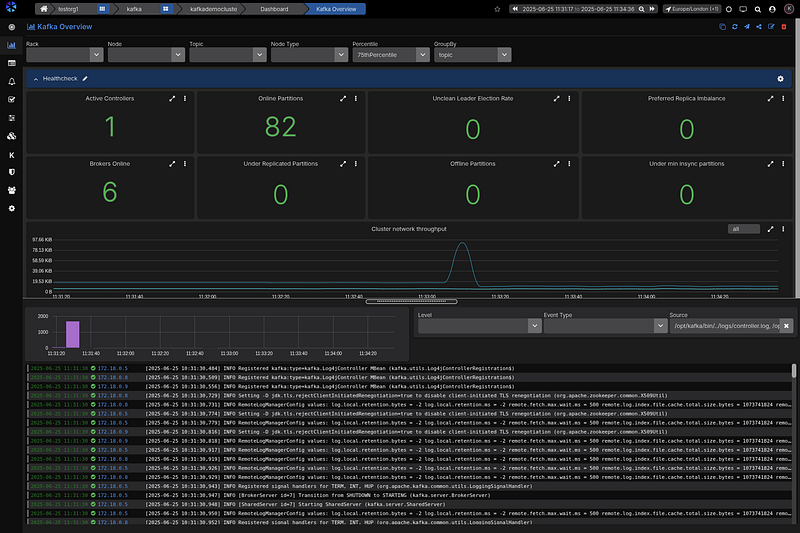
Logs overlaying dashboard
This unified view makes it dramatically easier to correlate events and diagnose issues faster — keeping you in flow and cutting your time-to-resolution.
Core Kafka Monitoring Features:
Some of the monitoring capabilities of AxonOps include:
- Broker performance and topic metrics
- Partition and replication monitoring (including under-replicated partitions)
- Real-time consumer group lag tracking
- Alerts, service checks, and historical trend analysis
- Log overlay for context-aware troubleshooting
- Deep views into consumer groups, ACL, and broker-level configuration
- Topic management from the same UI
Operational Control: Not Just Metrics
Monitoring is only half the story. AxonOps also provides operational tooling to manage Kafka resources via the same platform:
Kafka Topic Management
AxonOps provides full topic management, supporting all CRUD operations — create, read, update, and delete — directly from the UI.
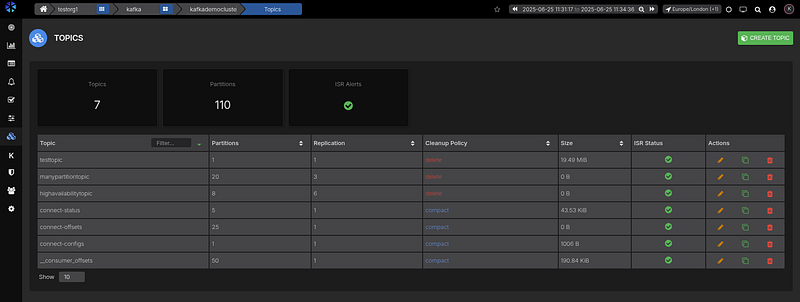
Searchable list of Topics
You can easily view topic configurations, with clear indicators showing whether a setting is using the default value or has been manually overridden. Each topic view also gives you deep visibility into partition details, associated consumer groups, and any ACLs that apply to that topic — all in one place.
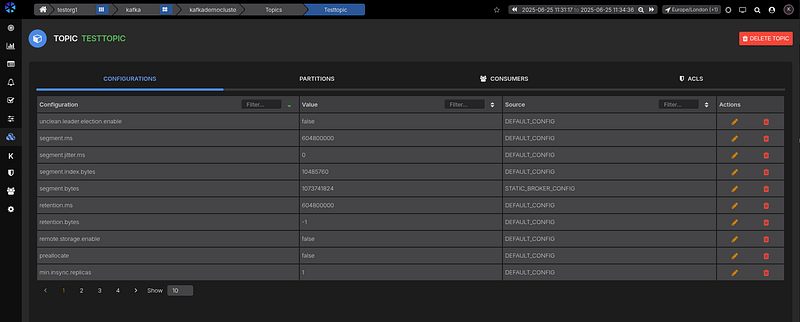
Topic Configurations
New topics can be created with advanced configurations, giving you full control over settings like partition count, replication factor, retention policies.

Create new topics with advanced configurations
Kafka ACL management
Managing Kafka ACLs is notoriously painful. Most tools offer limited or no support for ACL management, and the built-in CLI is cumbersome to use and automate. As a result, teams often skip ACLs entirely or fall back on overly permissive rules — leading to insecure and hard-to-audit Kafka environments.
AxonOps makes ACL management easy and accessible. You can quickly search, view, and create ACLs through a clear, user-friendly interface — no CLI wrangling required.
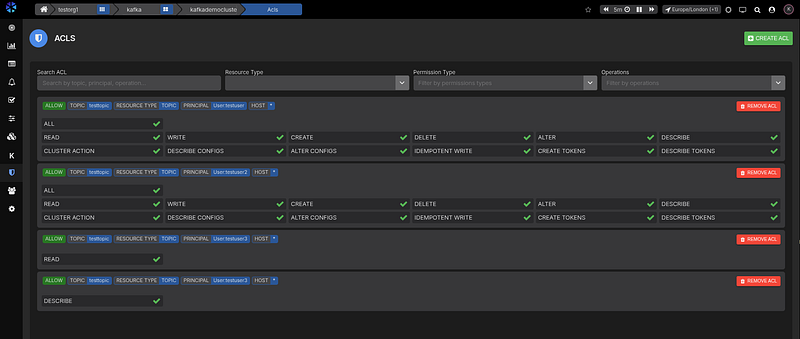
Searchable list of ACLs
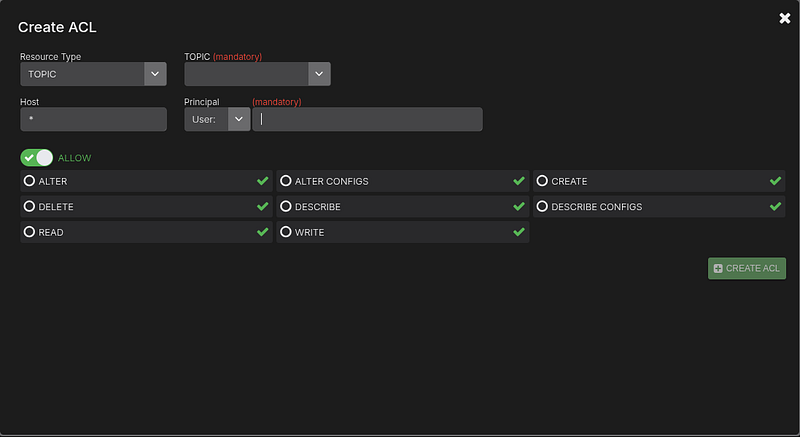
Create ACLs
With AxonOps, you can secure your Kafka cluster without the operational overhead that typically comes with managing ACLs.
Kafka Broker views and health checks
You can easily get an entire cluster health status from a single view.
All nodes and their health are displayed and issues are easy to identify from a single glance!
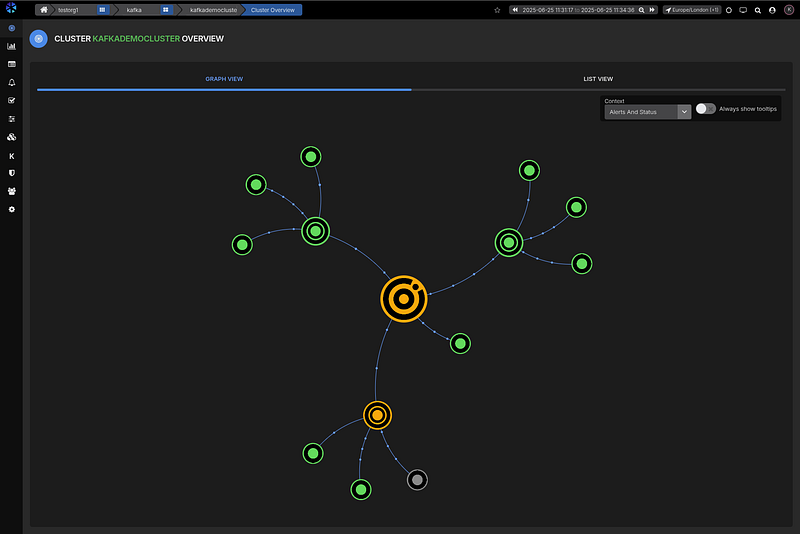
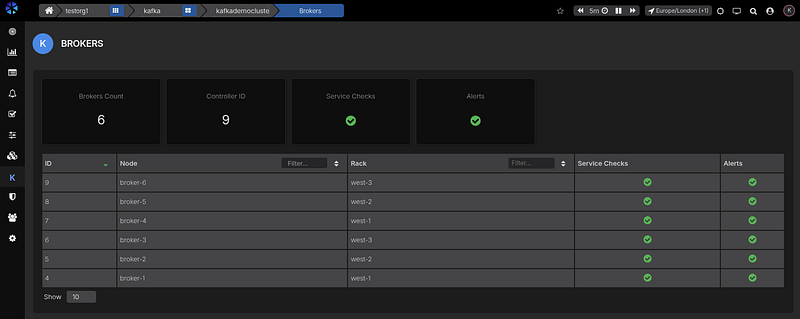
Broker overview with health indicators
Kafka Broker settings can be easily searched so you know exactly how they are configured.
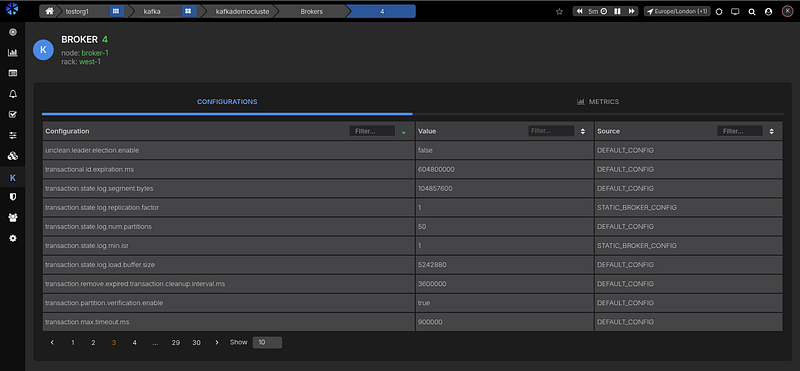
Broker configuration viewer
Consumer group insights
How often do business teams raise concerns about missing data, only for you to discover a lagging or crashed Kafka consumer, with millions of unprocessed messages piling up? It’s a frustrating and all-too-common scenario.
AxonOps delivers real-time consumer group lag tracking, so you can spot issues before they turn into incidents. Even better, you can configure targeted alerts for specific consumer groups or topics — with thresholds and duration filters to avoid alert fatigue from brief, expected spikes.
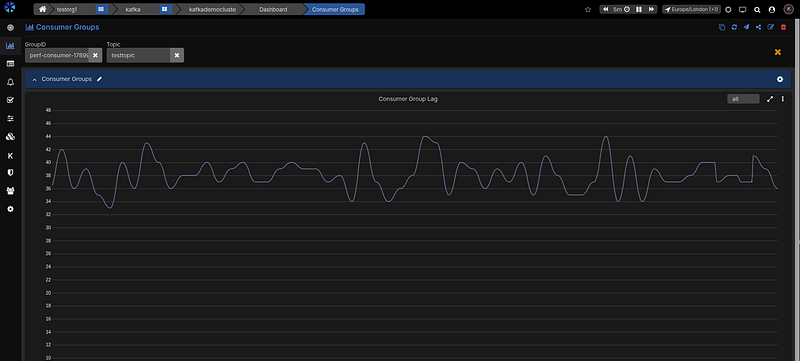
Real Time consumer group lag reporting
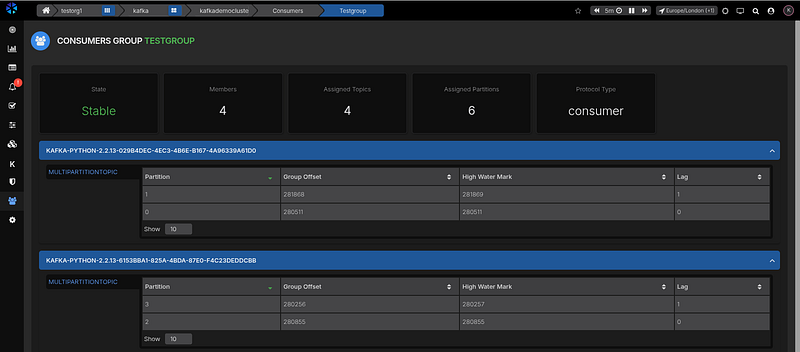
In addition to real-time visibility, AxonOps lets you deep dive into all consumer groups in your cluster. You can quickly see:
- Who is consuming from which topics and partitions
- Where lag is accumulating
- And how consumers are distributed across the cluster
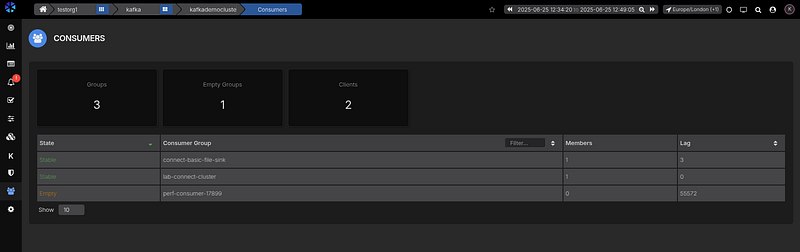
See all consumer groups
In the Pipeline
We’re just getting started. Coming soon:
- Partition management
- Kafka Connect orchestration
- Schema Registry visibility and drift detection
- Advanced Consumer Group lifecycle management
- Hung transaction detection and recovery
- Live message streaming — designed with a clear boundary between data plane and control plane for operational safety
Efficiency by Design
The underlying protocol powering AxonOps is designed for high throughput and minimal overhead.
You can see a report created by an independent party who performed a deep dive analysis of how AxonOps telemetry protocol works.
Its focused on AxonOps for Cassandra but the same protocol is used for Kafka
https://axonops.com/blog/monitoring-cassandra-the-cost-of-collecting-metrics/
Why It Matters
Kafka is a cornerstone of data platforms — but managing it shouldn’t require a patchwork of tools. With AxonOps, you get observability, alerting, logging, and control — all in one portal, without compromising on speed or scale.
If you’re building serious data infrastructure, AxonOps is your single pane of glass for Kafka — and more.
Want to test it out?
There are a couple of easy ways to explore what AxonOps can do for your Kafka environment:
Explore the Demo:
Check out our public demo site here:
https://axonops.com/demo-sandbox/
This gives you a live view of the AxonOps interface and Kafka cluster monitoring in action. Note: CRUD operations and advanced features are disabled in the demo — it’s read-only.
Connect Your Own Cluster (Free License):
Want the full experience? You can get a free 6-node license to connect your own Kafka cluster and try out the complete feature set, including advanced configuration, alerting, and ACL management.
About AxonOps
Organizations turn to AxonOps to democratise Apache Cassandra and Kafka skills through best-in-class management tooling, backed by world-class support. Built by experts, our unified monitoring and operations platform for Apache Cassandra and Kafka provides access to all of the capability required to effectively monitor and operate a Cassandra and Kafka environment via the APIs or UI of a single management control plane.
Latest Articles
Stay up-to-date on the Axonops blog
Book time with an AxonOps expert today!
